

Every recurring fatal has a triggering request
PHP fatal errors and memory exhaustion usually have a specific request behind them. When the same fatal error returns, the same type of request is often triggering it.
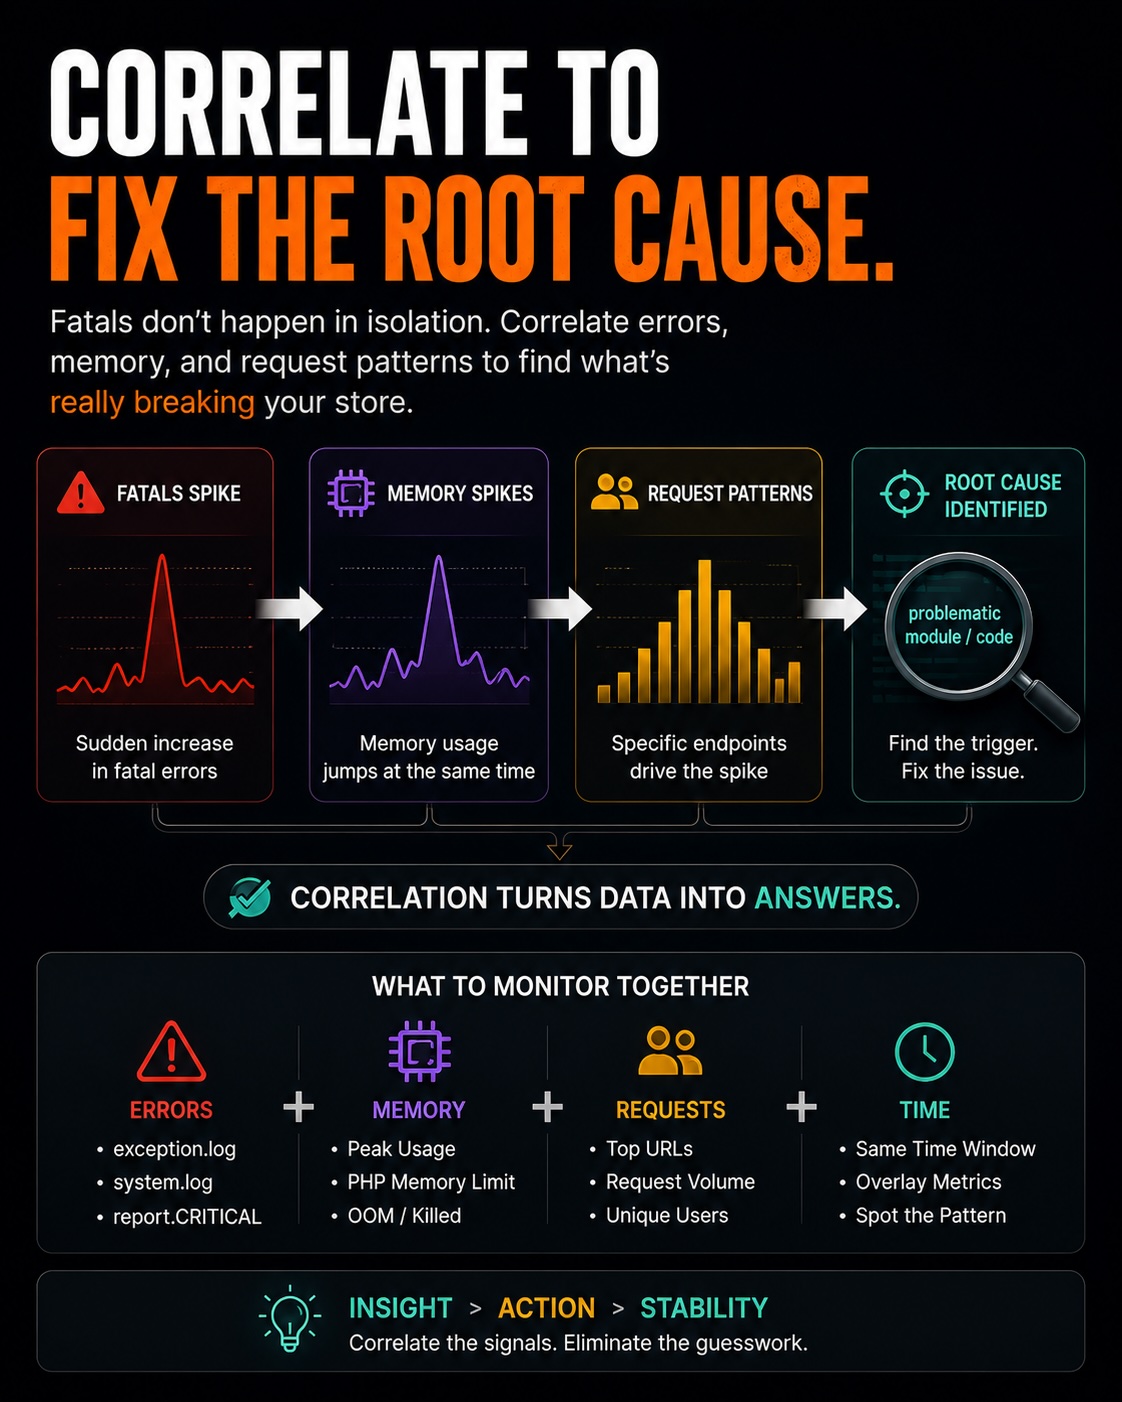
The error message tells you what failed. Correlation tells you which request caused the failure. That turns a long list of fatals into a cause you can investigate and fix.
This article explains how to connect fatal and memory errors to the requests that caused them by using the logs and traces the store already produces.
Error logs and access logs show different details
The fatal error and the request are usually recorded separately. A memory exhaustion error goes into the PHP or application log. The request that triggered it goes into the web server access log.
The PHP or application log shows what failed. The access log shows the HTTP method, URL, status, and request time. You need both logs to connect the failure to a page or endpoint.
This changes the investigation from "we get memory errors" to "this page causes memory errors." The second statement gives you a path to inspect.
Match fatal timestamps to access logs
Start with time. The fatal has a timestamp, and the access log records the request made at that time.
Compare the timestamp, HTTP method, URL, status, and response time. If several requests share the same second, use those fields to narrow the list. When the same URL appears beside the same fatal more than once, you have found a repeatable request pattern.
Request patterns that trigger memory failures
Some request patterns often trigger fatal errors. Recognizing them makes log correlation faster:
- A category page with many layered-navigation filters applied, generating a huge query and result set.
- An API endpoint pulling a large collection without pagination.
- An export or report URL building a big dataset in memory.
- A bot hitting a heavy, uncached URL repeatedly at high frequency.
When the access log shows one of these requests beside a memory fatal, the pattern may explain the recurrence. The request is doing more work or holding more memory than the configured limit allows.
APM can connect errors to code paths
If the store uses application performance monitoring (APM), correlation is easier. Transaction traces connect an error to the endpoint and code path that produced it, without manual log matching.
An APM tool that groups errors by transaction shows which endpoint produces the fatals. It also shows the transaction's memory use and duration. Those details point to the expensive part of the request.
APM can perform the log correlation automatically and add code-level detail that the logs do not contain.
PHP-FPM slow logs catch heavy requests
The PHP-FPM slow log sits between the access log and full monitoring. It records requests that exceed the configured duration threshold and writes a stack trace for each one.
Memory-heavy requests often run slowly, so the slow log can catch requests that also produce fatal errors. Its stack trace shows the code that was running when PHP-FPM recorded the request. That points to the expensive code path.
Enable and review the slow log to connect slow, heavy requests to their code. Use it with access-log timestamp correlation for a fuller view.
Use the pattern to find the root cause
Once you identify the request pattern, the root cause is usually close. A category page that produces fatals with many filters points to the layered-navigation query and result size. An export that produces fatals points to a dataset being built in memory.
Match the fix to the pattern. Paginate the unbounded collection, precompute the heavy report, add an index to the query behind the slow page, or rate-limit a bot hitting the heavy URL.
Correlation keeps the fix focused. It shows which request needs attention, so you can address that path before changing the server's memory limits.
Recurring fatals reveal repeat requests
A one-time fatal may be a fluke. A recurring fatal points to a request pattern. Correlation helps you find the request that keeps triggering it.
When the same fatal appears again, match it to the requests around its timestamp. Compare the page, endpoint, response time, and request frequency.
This turns recurring fatals into a short list of pages and endpoints to fix.
Find the request and fix the cause
Requests trigger fatal and memory errors. Recurring errors point to recurring request patterns. Match the error with the access log, slow log, or transaction trace to identify the request behind it.
Then fix the specific request path before raising memory limits. This correlation work is a core part of a stability review.