

Slow queries are technical debt you can read directly
Most technical debt is inferred from symptoms. Database query debt is different, because the database will tell you exactly which queries are slow and why, if you ask it.
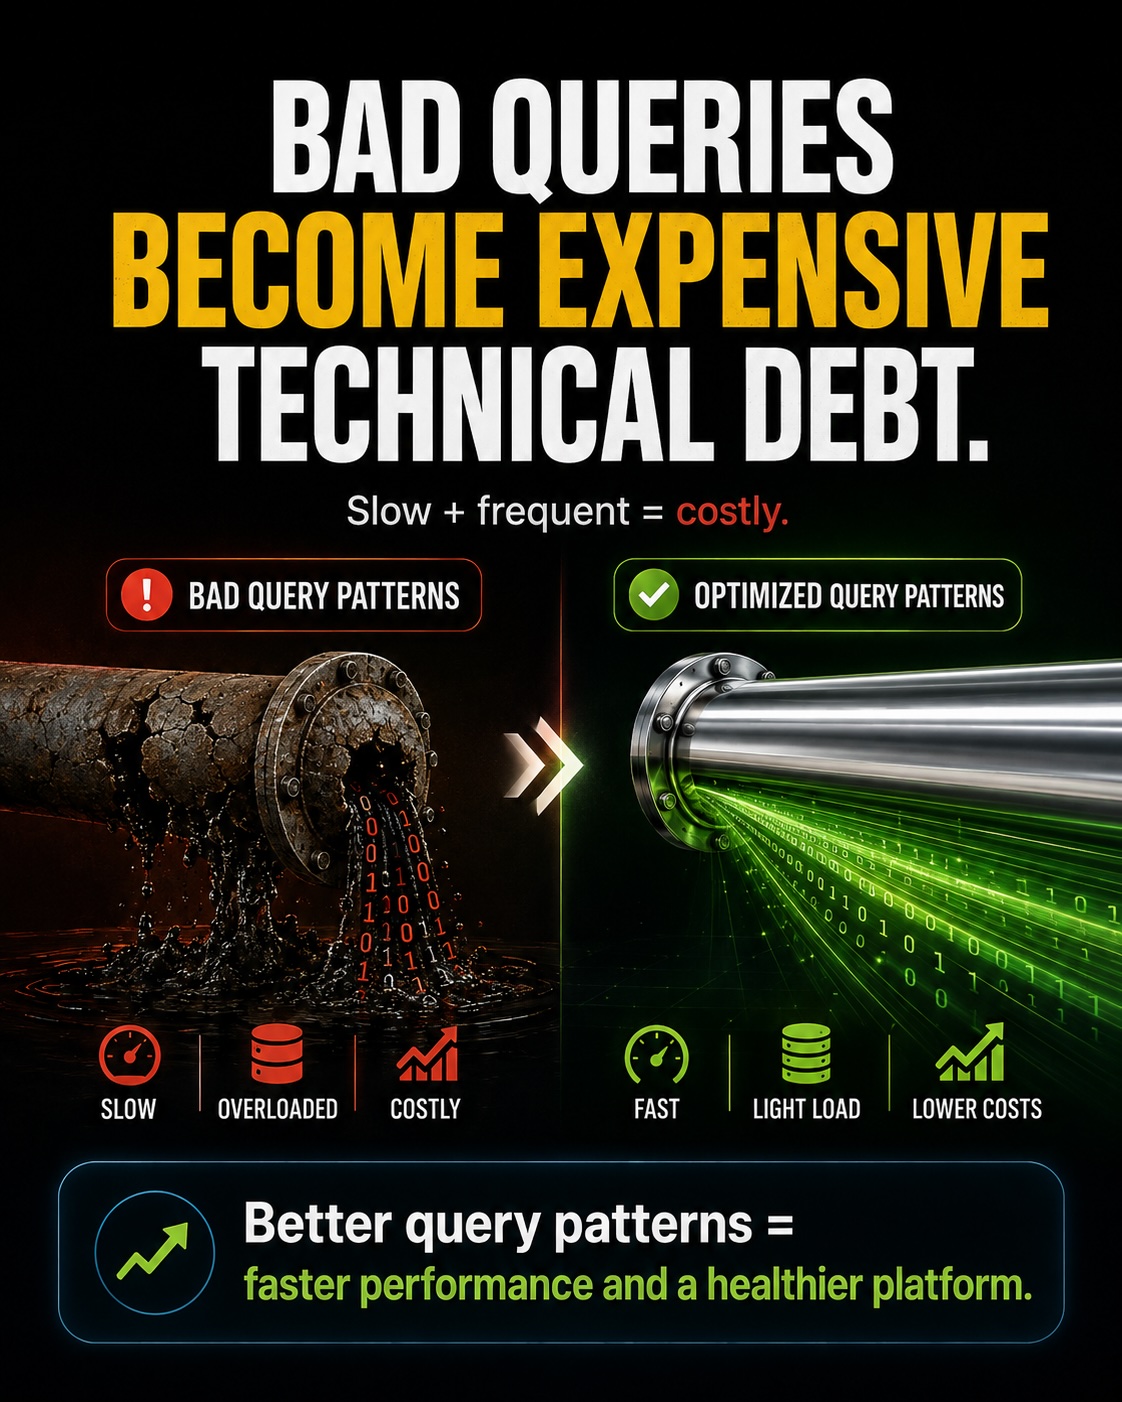
The patterns that show up in a slow query log are not random. They point at specific decisions in custom code and extensions that will only get more expensive as the catalog and order history grow.
This article covers how to capture the slow queries, how to read a query plan, and the recurring patterns that mark hidden debt: the N+1 collection load, the EAV join, the missing index, and the query that sorts in memory.
Capture the slow queries first
You cannot fix what you have not measured. MySQL and MariaDB both include a slow query log that records every query over a time threshold, and it costs almost nothing to run.
Enable it with a few settings, then let it collect during real traffic:
SET GLOBAL slow_query_log = 'ON';
SET GLOBAL long_query_time = 1;
SET GLOBAL log_queries_not_using_indexes = 'ON';
-- confirm where it writes
SHOW VARIABLES LIKE 'slow_query_log_file';
A threshold of one second is a reasonable start. Lower it later once the worst offenders are gone, because a query that runs thousands of times at half a second is still a real cost even if it never crosses one second individually.
Read the log by aggregate, not line by line
A raw slow log on a busy store is thousands of lines. Reading it top to bottom tells you what was slow last, not what is slow most, which is the number that matters.
Percona Toolkit's pt-query-digest aggregates the log by query fingerprint, so the same query with different values groups together. It ranks by total time, which is frequency multiplied by duration, and that ranking is your real problem list.
An aggregate report ranks queries by total time, exposing the frequent offenders a raw log hides.
Read the query plan with EXPLAIN
Once you have a slow query, EXPLAIN shows how the database executes it. The columns to read first are type, rows, and Extra.
A type of ALL means a full table scan, reading every row to answer the query. A large rows estimate means the database expects to examine many rows, and the Extra column reveals expensive operations like Using filesort and Using temporary.
Those three signals together tell you whether the query is doing a reasonable amount of work or grinding through the whole table because it has no better option.
EXPLAIN exposes full scans, filesorts, and temporary tables, the fingerprints of an expensive query.
EXPLAIN ANALYZE for real timings
Plain EXPLAIN shows the plan the optimizer intends to use, based on estimates. It does not tell you what actually happened when the query ran.
On MySQL 8.0.18 and later, and on recent MariaDB, EXPLAIN ANALYZE runs the query and reports the real execution time and row counts per step. That turns a guess into a measurement, and it often reveals that the estimated row count was wildly off from reality.
A large gap between estimated and actual rows is itself a finding. It usually means the table statistics are stale, and an ANALYZE TABLE can restore the optimizer's ability to choose a good plan.
Catch it live with the process list
The slow log is a record of the past. To see what the database is doing right now, under load, watch the running queries directly.
SHOW FULL PROCESSLIST;During a traffic spike or a slow period, this shows every query in flight, how long each has been running, and its state. A query stuck in Sending data or Copying to tmp table for seconds is a live version of what the slow log records after the fact.
It is also how you find a single runaway query that is holding resources and dragging the whole store, which you can then terminate before it does more damage.
The N+1 collection load
The most common query pattern in custom Magento code is the N+1. Code loads a collection of items, then calls a getter inside a loop that lazy-loads related data one row at a time.
One query becomes one plus N, where N is the number of items in the collection. On a page listing fifty products, a lazy attribute access can turn into fifty extra queries, and the page slows in direct proportion to the catalog.
The fix is to load what you need up front. Using addAttributeToSelect for the attributes you will read, or joining the related data into the collection once, replaces N queries with one. In the slow log this pattern shows up as the same tiny query running an enormous number of times.
The cost of EAV
Magento stores product and customer data in the entity-attribute-value model, spread across tables like catalog_product_entity_varchar, _int, and _decimal. Reading several attributes means joining several tables, and that cost grows with attribute count.
Custom code that filters or sorts on EAV attributes can generate large, multi-join queries that scan far more rows than the result needs. These are frequent entries in the slow log on stores with rich product data.
The database is not broken when this happens. It is doing exactly what the query asked, and the query asked for something expensive. Recognizing an EAV-heavy query in the log tells you where a flat structure or a targeted index would pay off.
Missing indexes on custom tables
Extensions and custom modules add their own tables, and those tables do not always get the indexes they need. A query that filters or joins on an unindexed column forces a full scan every time.
The log_queries_not_using_indexes setting from earlier catches exactly these. When a custom table query shows type: ALL in EXPLAIN and the filtered column has no index, adding the index often turns a full scan into a single-row lookup.
Foreign-key columns are the usual suspects. A custom table that references entity_id or order_id without an index on that column will scan the whole table on every join.
Leading-wildcard LIKE and large IN lists
Two query shapes defeat indexes no matter how well the table is built. A LIKE '%term%' with a leading wildcard cannot use an index, because the database has no starting point to seek to.
Large IN() lists, built by passing hundreds or thousands of IDs into a query, are the other. These often come from custom code that collected a set in PHP and then asked the database to match all of it at once.
Both show up clearly in EXPLAIN as scans. The fix is usually in the code that built the query, not in the database: a proper search index for text, and a join or temporary table instead of a giant ID list.
Filesort and temporary tables
When EXPLAIN shows Using filesort, the database is sorting the result in memory or on disk because it cannot satisfy the ORDER BY from an index. Using temporary means it built a temporary table to complete the query, often for a GROUP BY or a complex join.
Both are acceptable on small result sets and expensive on large ones. A report or grid query that sorts a large unindexed result will filesort every time it runs.
An index that matches the sort order removes the filesort. When the query is a custom report, sometimes the better answer is to precompute the result rather than sort it live on every request.
Custom queries running inside loops
The worst pattern is a raw query executed inside a PHP loop, often in a custom module that bypassed Magento's collection layer entirely. Each iteration runs its own query, and the total scales with the data.
These are easy to spot in the aggregate report, because a single query fingerprint shows an implausibly high call count. Tracing it back usually leads to a loop that should have been a single set-based query.
Set-based thinking is the fix. Instead of asking the database one question per item, ask it one question about all the items, which is what relational databases are built to answer efficiently.
Where custom collections go wrong
Magento's collection layer is powerful and easy to misuse. The common mistakes all generate queries that look reasonable in code and expensive in the log.
Filtering a product collection with addAttributeToFilter on an unindexed EAV attribute forces a join and a scan. Manipulating the underlying select with getSelect() and adding a joinLeft without the right conditions can multiply rows, so the collection silently returns duplicates that the code then de-duplicates in PHP.
Calling load() on a large collection when only a count or a few fields are needed pulls entire objects into memory. Each of these is a small coding choice that becomes a heavy query, and each is visible in the slow log once you know the shape to look for.
Indexes have a cost too
The obvious fix for a slow query is often an index, and indexes are not free. Every index has to be updated on every insert, update, and delete to the table it covers.
On a write-heavy table, over-indexing slows the writes to speed up the reads, which can move the bottleneck rather than remove it. The goal is the smallest set of indexes that covers the real query patterns, not one index per column.
This matters most on the tables that both grow fast and are queried hard, like sales and quote tables. There, an index audit is as much about removing redundant indexes as adding missing ones.
Lock waits and long transactions
Not every slow query is slow because of its own work. Some are slow because they are waiting on a lock another transaction holds.
A long-running transaction, often from a custom import or a batch job, can hold locks that block ordinary storefront queries. Reading SHOW ENGINE INNODB STATUS shows current lock waits and the transactions involved, which is how a slow storefront traces back to a background job nobody connected to it.
The fix is usually to shorten the transaction: commit in batches rather than wrapping thousands of rows in one long transaction that holds locks the whole time.
Reads that belong in a report, not live
Some queries are slow because they are doing reporting work on the live storefront path. A dashboard-style aggregate, run on every page load, pays a heavy cost for data that changes slowly.
The answer is to precompute. Magento's own flat and index tables exist for exactly this reason, trading storage and a reindex step for fast reads at request time.
When a custom feature runs an expensive aggregate live, moving it to a precomputed table refreshed on a schedule removes the query from the hot path entirely. The slow log stops showing it because it no longer runs when customers are waiting.
The slow log threshold is a dial
The one-second threshold from earlier is a starting point, not a fixed setting. Once the worst queries are fixed, lower long_query_time to surface the next tier.
Dropping it to half a second, then a quarter, progressively reveals queries that were hiding just under the previous cutoff. A query at 0.4 seconds run ten thousand times an hour is more total load than a two-second query run twice.
The log_queries_not_using_indexes setting is noisier and worth turning on in bursts rather than permanently. It catches full scans regardless of duration, which is exactly the pattern that gets slower as tables grow.
Connections are a limit too
Slow queries do not only cost time, they hold connections. A query that runs for two seconds occupies a database connection for those two seconds, and connections are a finite resource.
When enough slow queries overlap under load, the database hits max_connections and starts refusing new ones with a "Too many connections" error. The storefront then fails for reasons that look like a database outage but are really a symptom of the slow queries upstream.
This is why query performance and connection exhaustion are the same problem seen from two angles. Fixing the slow queries usually resolves the connection pressure without touching the connection limit at all.
Read replicas are not a fix for bad queries
A common response to database load is to add a read replica and send read traffic to it. Magento supports this, and it genuinely helps distribute read-heavy load across more hardware.
It does not fix a bad query. A full table scan is still a full table scan on the replica, and moving it there just spreads the cost rather than removing it.
Use replicas to scale healthy read load, not to hide expensive queries. The slow log analysis comes first, because there is little point buying hardware to run inefficient queries faster.
Stale statistics fool the optimizer
Sometimes a query that was fast for months suddenly turns slow with no code change. The usual cause is that the table statistics the optimizer relies on have gone stale.
The optimizer chooses a plan based on its estimate of how many rows each step will touch. When those estimates drift far from reality, it can pick a bad plan, such as a full scan where an index would have worked.
Running ANALYZE TABLE refreshes the statistics and often restores the good plan. When a previously healthy query degrades on its own, check the statistics before assuming the query or the data changed.
Turning findings into fixes
A slow query analysis produces a ranked, evidence-backed list of exactly where the database work is going. That is rare in performance work, where most problems have to be inferred.
Rank the queries by total time, fix from the top, and re-measure. Some fixes are an index, some are a code change to load data differently, and some are a decision to precompute an expensive report.
Knowing which queries cost the most, and why each is slow, turns database performance from a vague complaint into a short, prioritized worklist. That worklist is one of the most actionable outputs a performance-focused platform review can produce.