

On this page
Why GTmetrix is the report clients actually understand
GTmetrix has a quality that the more technical tools do not. It hands you a single letter grade, A through F, that anyone can read at a glance, which is why it is the report I most often end up putting in front of a store owner rather than a developer.
That grade is also where GTmetrix can mislead you, because a letter feels final in a way that a pile of numbers does not. A B can hide a real problem, and an A does not automatically mean your customers are having a fast time.
This article walks through what the GTmetrix grade is actually built from, how to read the tabs behind it, and how to turn any of it into a fix inside Magento. I am running it against my own site, jasonschuman.com, so every screenshot here is a real result.

What GTmetrix is and how it scores you
GTmetrix is a web performance tool that loads your page on a real browser from a chosen location and turns the result into a report. Under the hood it runs on Google's Lighthouse engine, so the raw metrics are close cousins of what you see in PageSpeed Insights.
What GTmetrix adds on top is presentation. It rolls the results into a headline grade, a Performance score, and a Structure score, and it lays out the detail across clean tabs you can hand to someone who does not read waterfalls.
So think of GTmetrix as a friendly front end over familiar data. The metrics are serious, and the packaging is what makes them easy to act on and easy to share.
The Performance score and the Structure score are different
The headline grade is built from two separate scores, and knowing the difference is the key to reading the whole report. The Performance score reflects how fast the page actually loaded in this test, measured from the Lighthouse metrics.
The Structure score reflects how well the page is built against performance best practices, whether or not it was fast this particular time. A page can load quickly on a good run yet still be built in a way that will bite you under load.

Where it fits next to the other tools
GTmetrix, PageSpeed Insights, and WebPageTest overlap, and I use each for a different moment. GTmetrix is the one I reach for when I need a clear, shareable report that a non technical person can act on or approve a budget from.
PageSpeed Insights is better for the real user field data, which I covered in how to read PageSpeed Insights for a Magento store. WebPageTest is better for deep request level debugging, which I covered in how to use WebPageTest on a Magento store.
A simple way to divide them is that GTmetrix explains the problem to people, PageSpeed Insights tells you if real customers feel it, and WebPageTest shows you exactly where it lives.
Free versus paid, and what the free account gives you
GTmetrix is free to use, and a free account is worth creating because it opens up more than the anonymous test does. With a free login you can pick from a handful of test locations, save your report history, and adjust some of the test settings.
The paid plans are about range and automation. They add more test locations around the world, real mobile devices, the ability to throttle the connection to a slower speed, and scheduled monitoring that re runs your tests and alerts you when something slips.
For learning the tool and auditing a store by hand, the free account is plenty. The paid features become worth it when you want GTmetrix watching your store on a schedule rather than only when you remember to check.
Running your first test
Enter your URL and run the test, but before you trust the result, look at the analysis options. GTmetrix lets you set the test location, the browser, and on paid plans the device and connection, and those choices change the numbers.
Test a real page that matters, not only the homepage. A category page and a product page carry different weight, and your checkout is the page where speed turns most directly into money, so it deserves its own test.
Run the same page a couple of times as well. One test can catch a warm cache or a cold one, and a store on Magento swings between those depending on recent deploys and traffic.

Before you trust the grade, set the test location. GTmetrix tests from a fixed spot, and the wrong one measures the wrong distance to your server.
Reading the Grade and the summary
The report opens on a summary that shows the grade, the Performance and Structure scores, and a short list of the headline metrics. This is the view built for sharing, and it is the one to read first.
Start with the grade for the temperature, then immediately split it into its two scores so you know whether you are looking at a speed problem or a build quality problem. Then glance at the metrics underneath, because they tell you which part of the load was slow.
Resist the urge to stop at the letter. The grade is a summary of the detail, and the detail is where the actual work is.
The Core Web Vitals it puts front and center
GTmetrix shows the Core Web Vitals prominently, because they are the metrics that map most directly to what a customer feels. The three it leads with are Largest Contentful Paint, Total Blocking Time, and Cumulative Layout Shift.
Largest Contentful Paint is when the main content appears, Total Blocking Time is how long the page was busy and unresponsive while scripts ran, and Cumulative Layout Shift is how much the page jumped around as it loaded. Each one points at a different layer of your store.
These are lab measurements from this one test, so treat them as a diagnosis you can reproduce, and pair them with the real user field data from PageSpeed Insights to confirm your customers actually feel the problem.
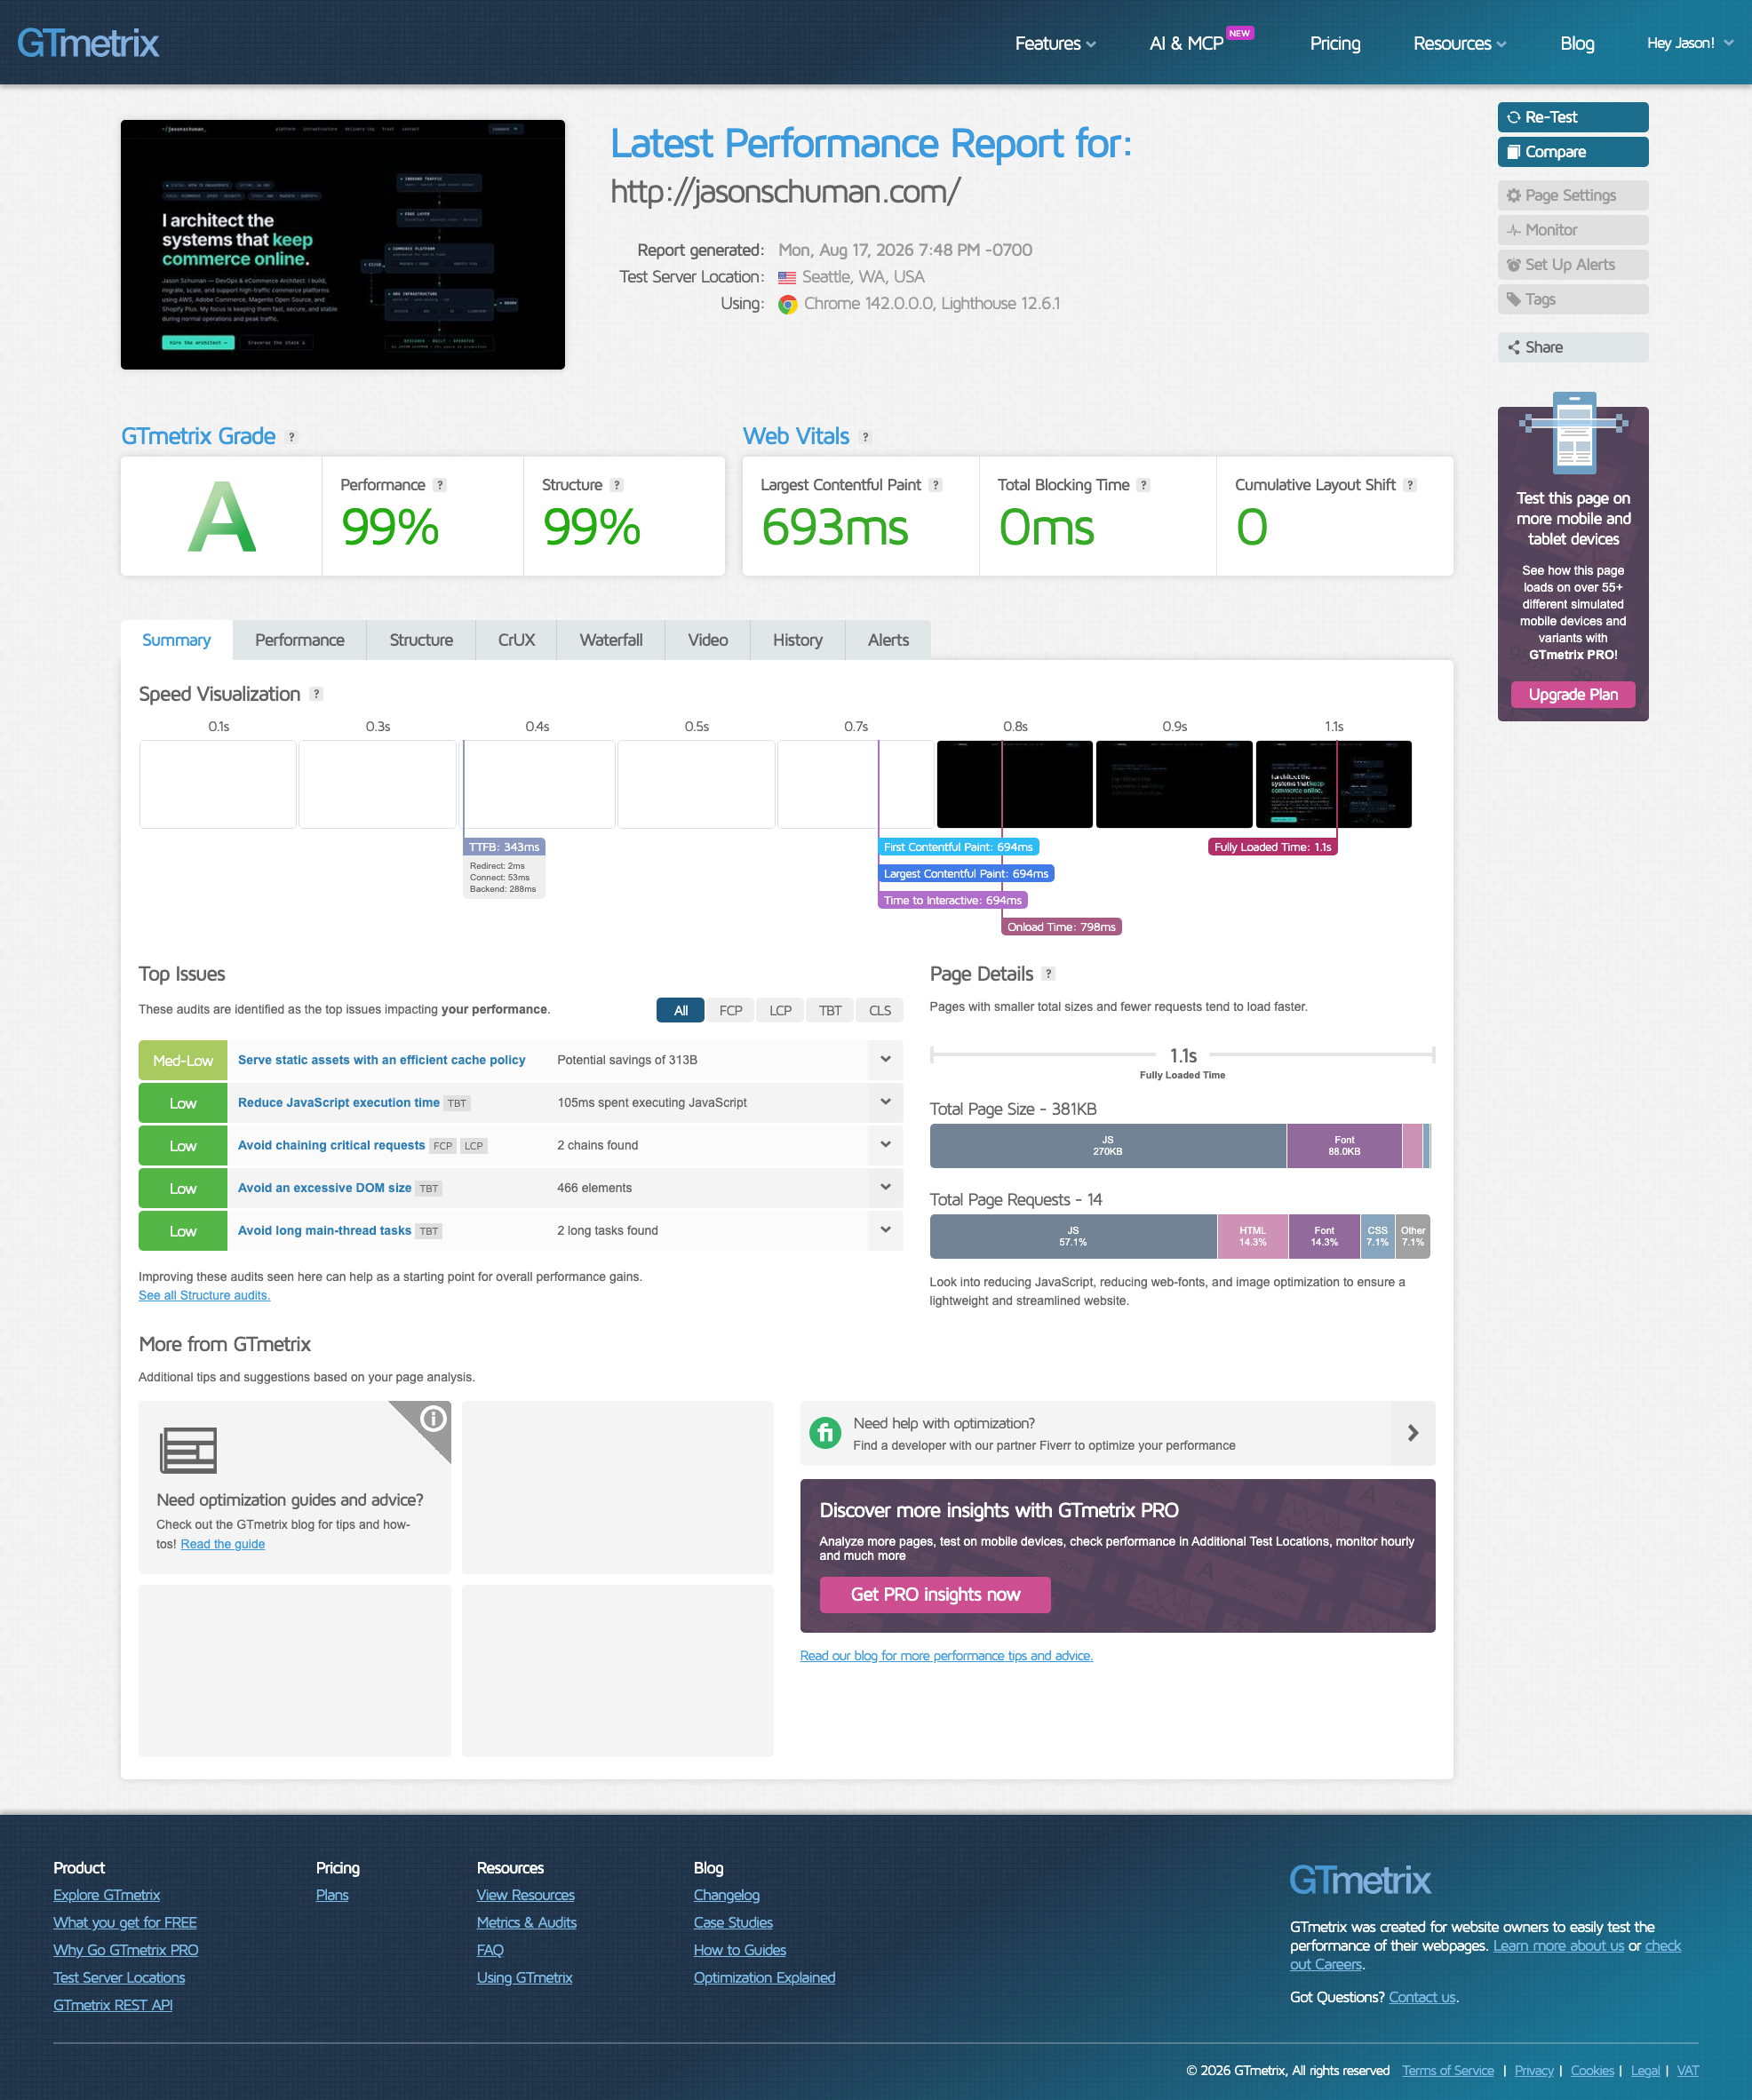
The GTmetrix summary: the grade, the two scores that build it, and the Core Web Vitals row underneath.
The loading video shows the wait
GTmetrix can capture the page loading as a short video and a strip of frames, which is the most honest way to show someone what the wait actually feels like. Numbers describe the load, but the frames let you watch it happen. It is a small part of the report that does a surprising amount of the persuading.
Scrub through it and you can see the exact moment the page was still blank, the moment the first content appeared, and the moment it finished. On a heavy Magento store that blank stretch at the start is often longer than anyone on the team realized.
This is the view I use when a store owner is not convinced there is a problem. A grade can be argued with, but a video of their own homepage sitting blank for three seconds usually ends the debate.
The Structure tab and how your page is built
The Structure tab is where GTmetrix lists the specific best practices your page passed or failed, each with a letter of its own and an impact rating. This is the most useful tab for a developer, because it is a prioritized list of what to fix.
The items with the highest impact and the lowest grade are your starting point. On a Magento store these usually cluster around render blocking resources, oversized images, and heavy JavaScript, which are the same offenders every performance tool surfaces in its own words.
Work the list from the top down. Fixing the two or three highest impact items almost always moves the grade more than a dozen small tweaks lower down.
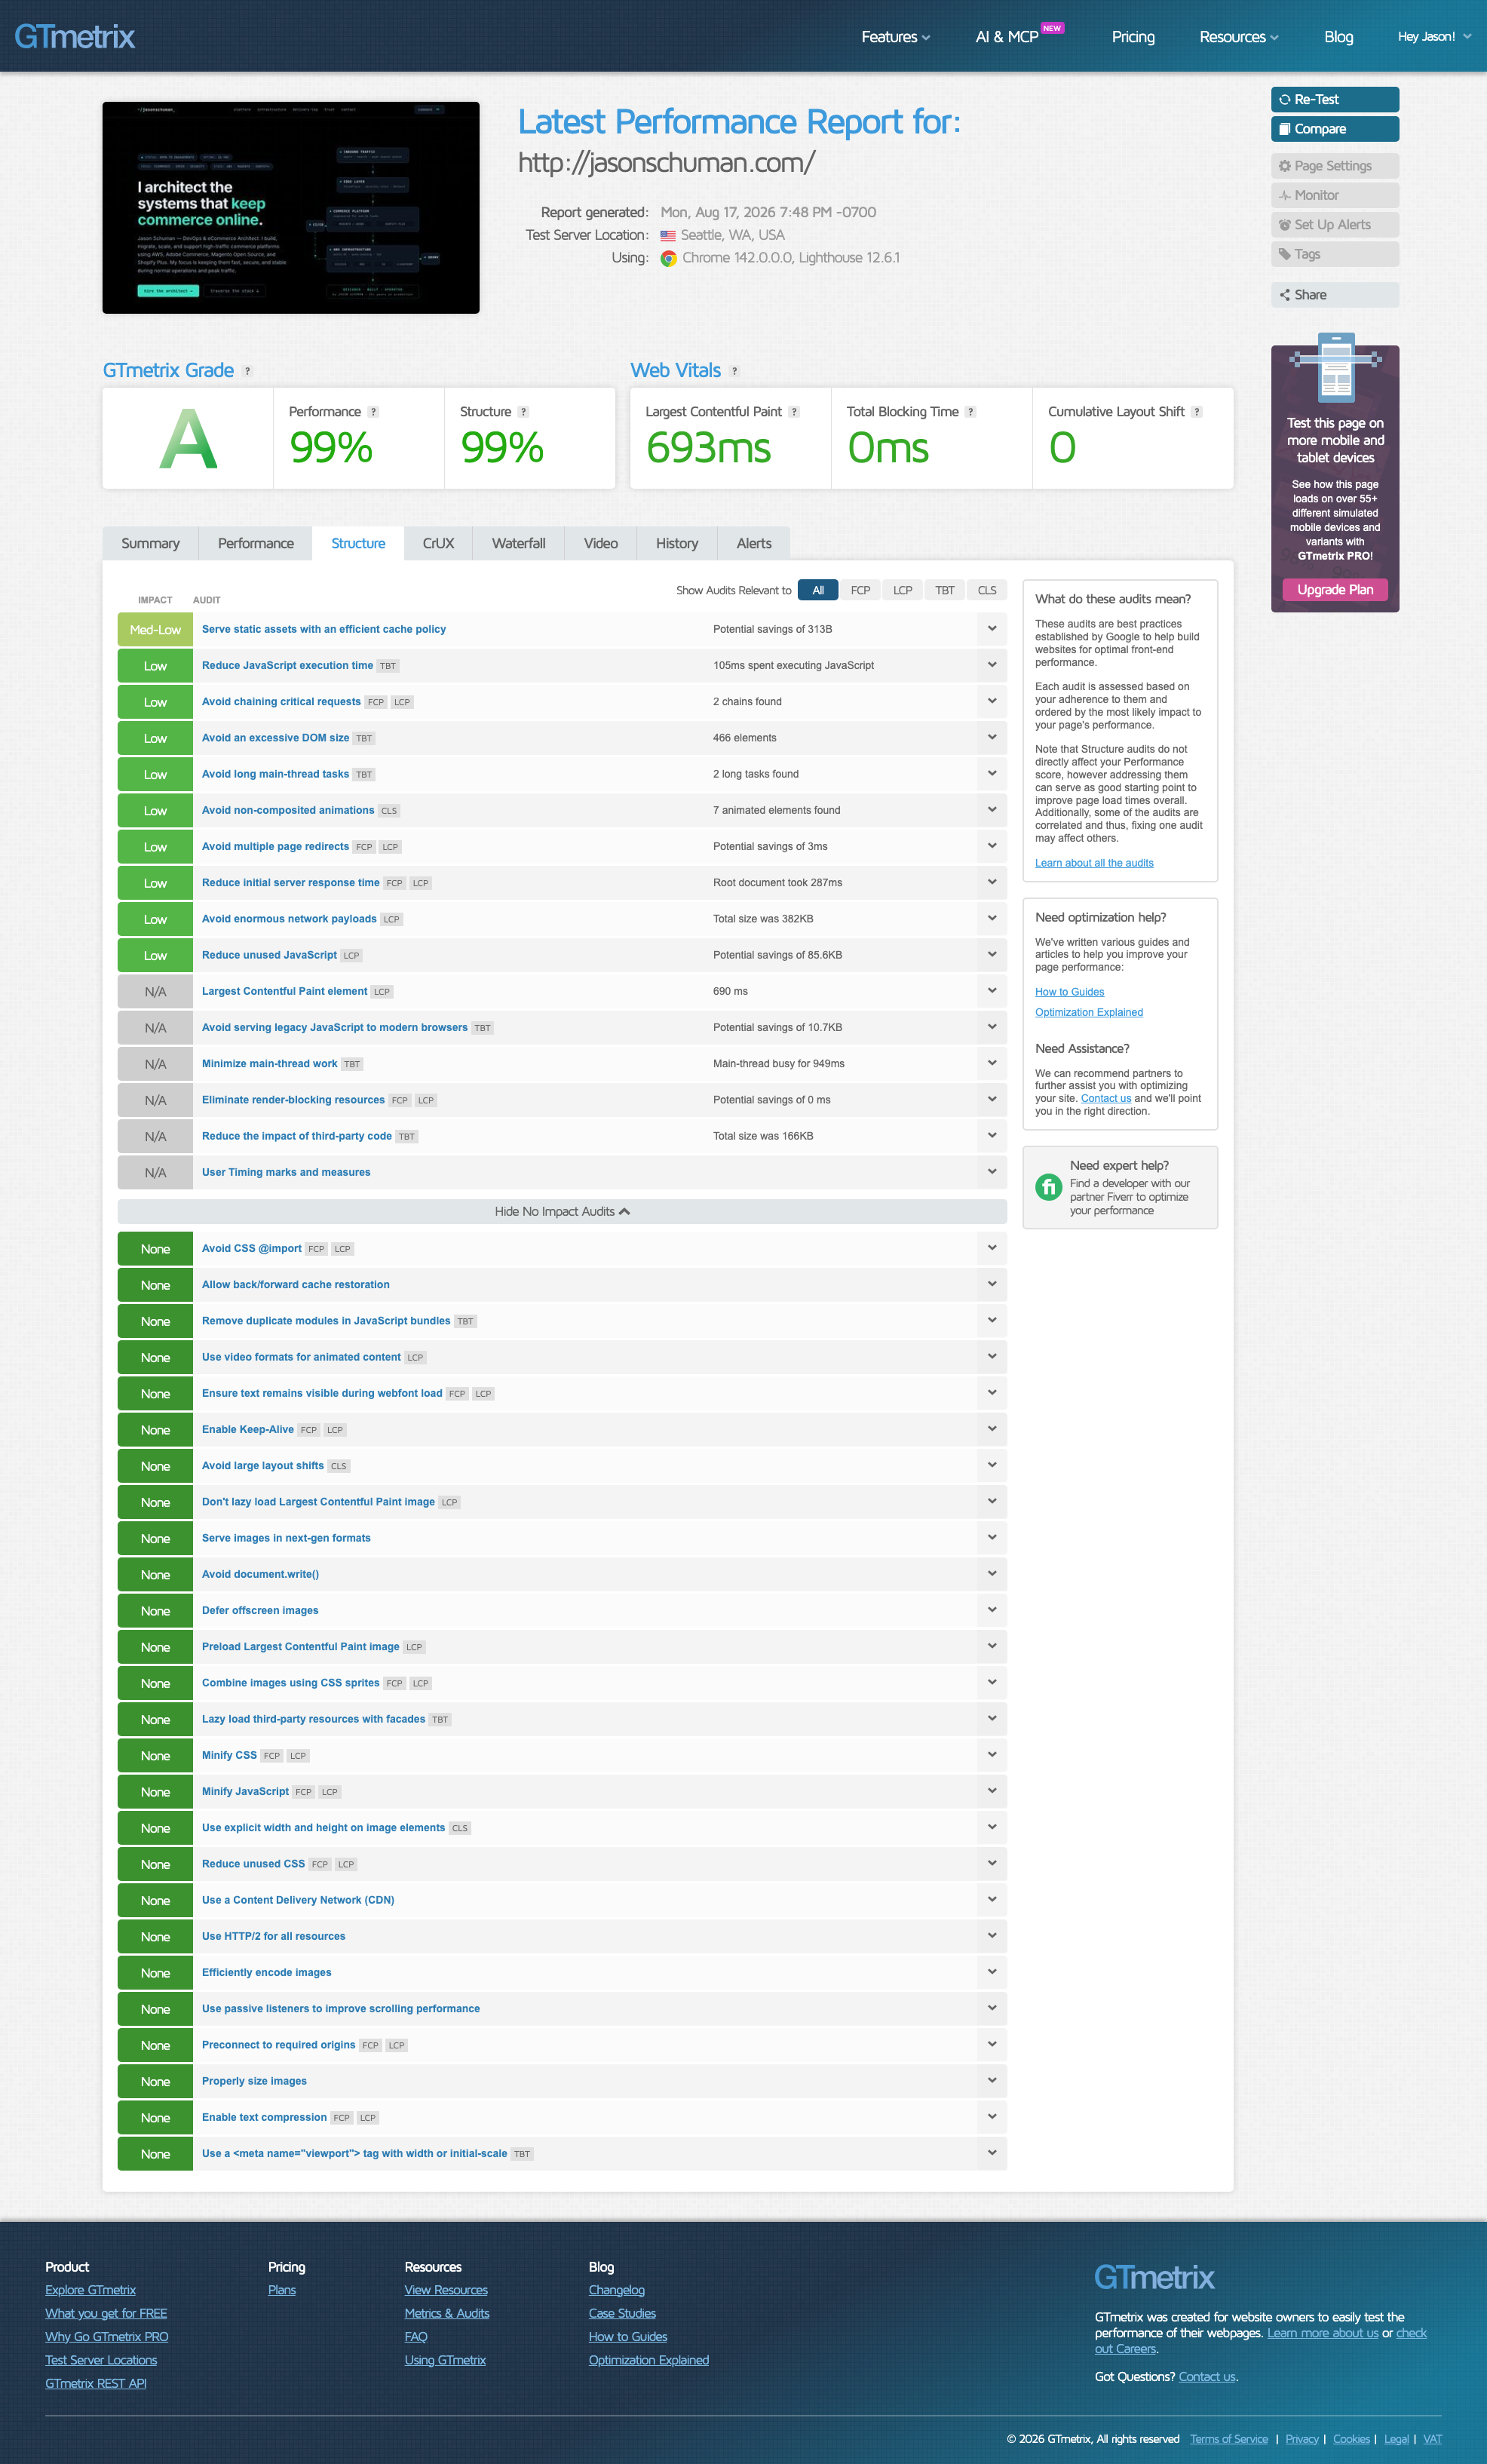
The Structure tab is a prioritized to do list. Sort by impact, start at the top, and let the low grade items with the highest impact set your order.
The Waterfall tab
The Waterfall tab shows every request the page made, drawn as bars in the order the browser fetched them. It is the same idea as the WebPageTest waterfall, and it is where you go when a score tells you there is a problem but not where.
Read it from the top. The first bar is the server responding, long bars are slow individual files, and a cluster of image requests low in the chart is usually where a Magento store is shipping more bytes than it needs to.
If the waterfall is where your interest ends up, that is a sign you want the deeper tool, and the WebPageTest guide I linked earlier goes further into reading one.
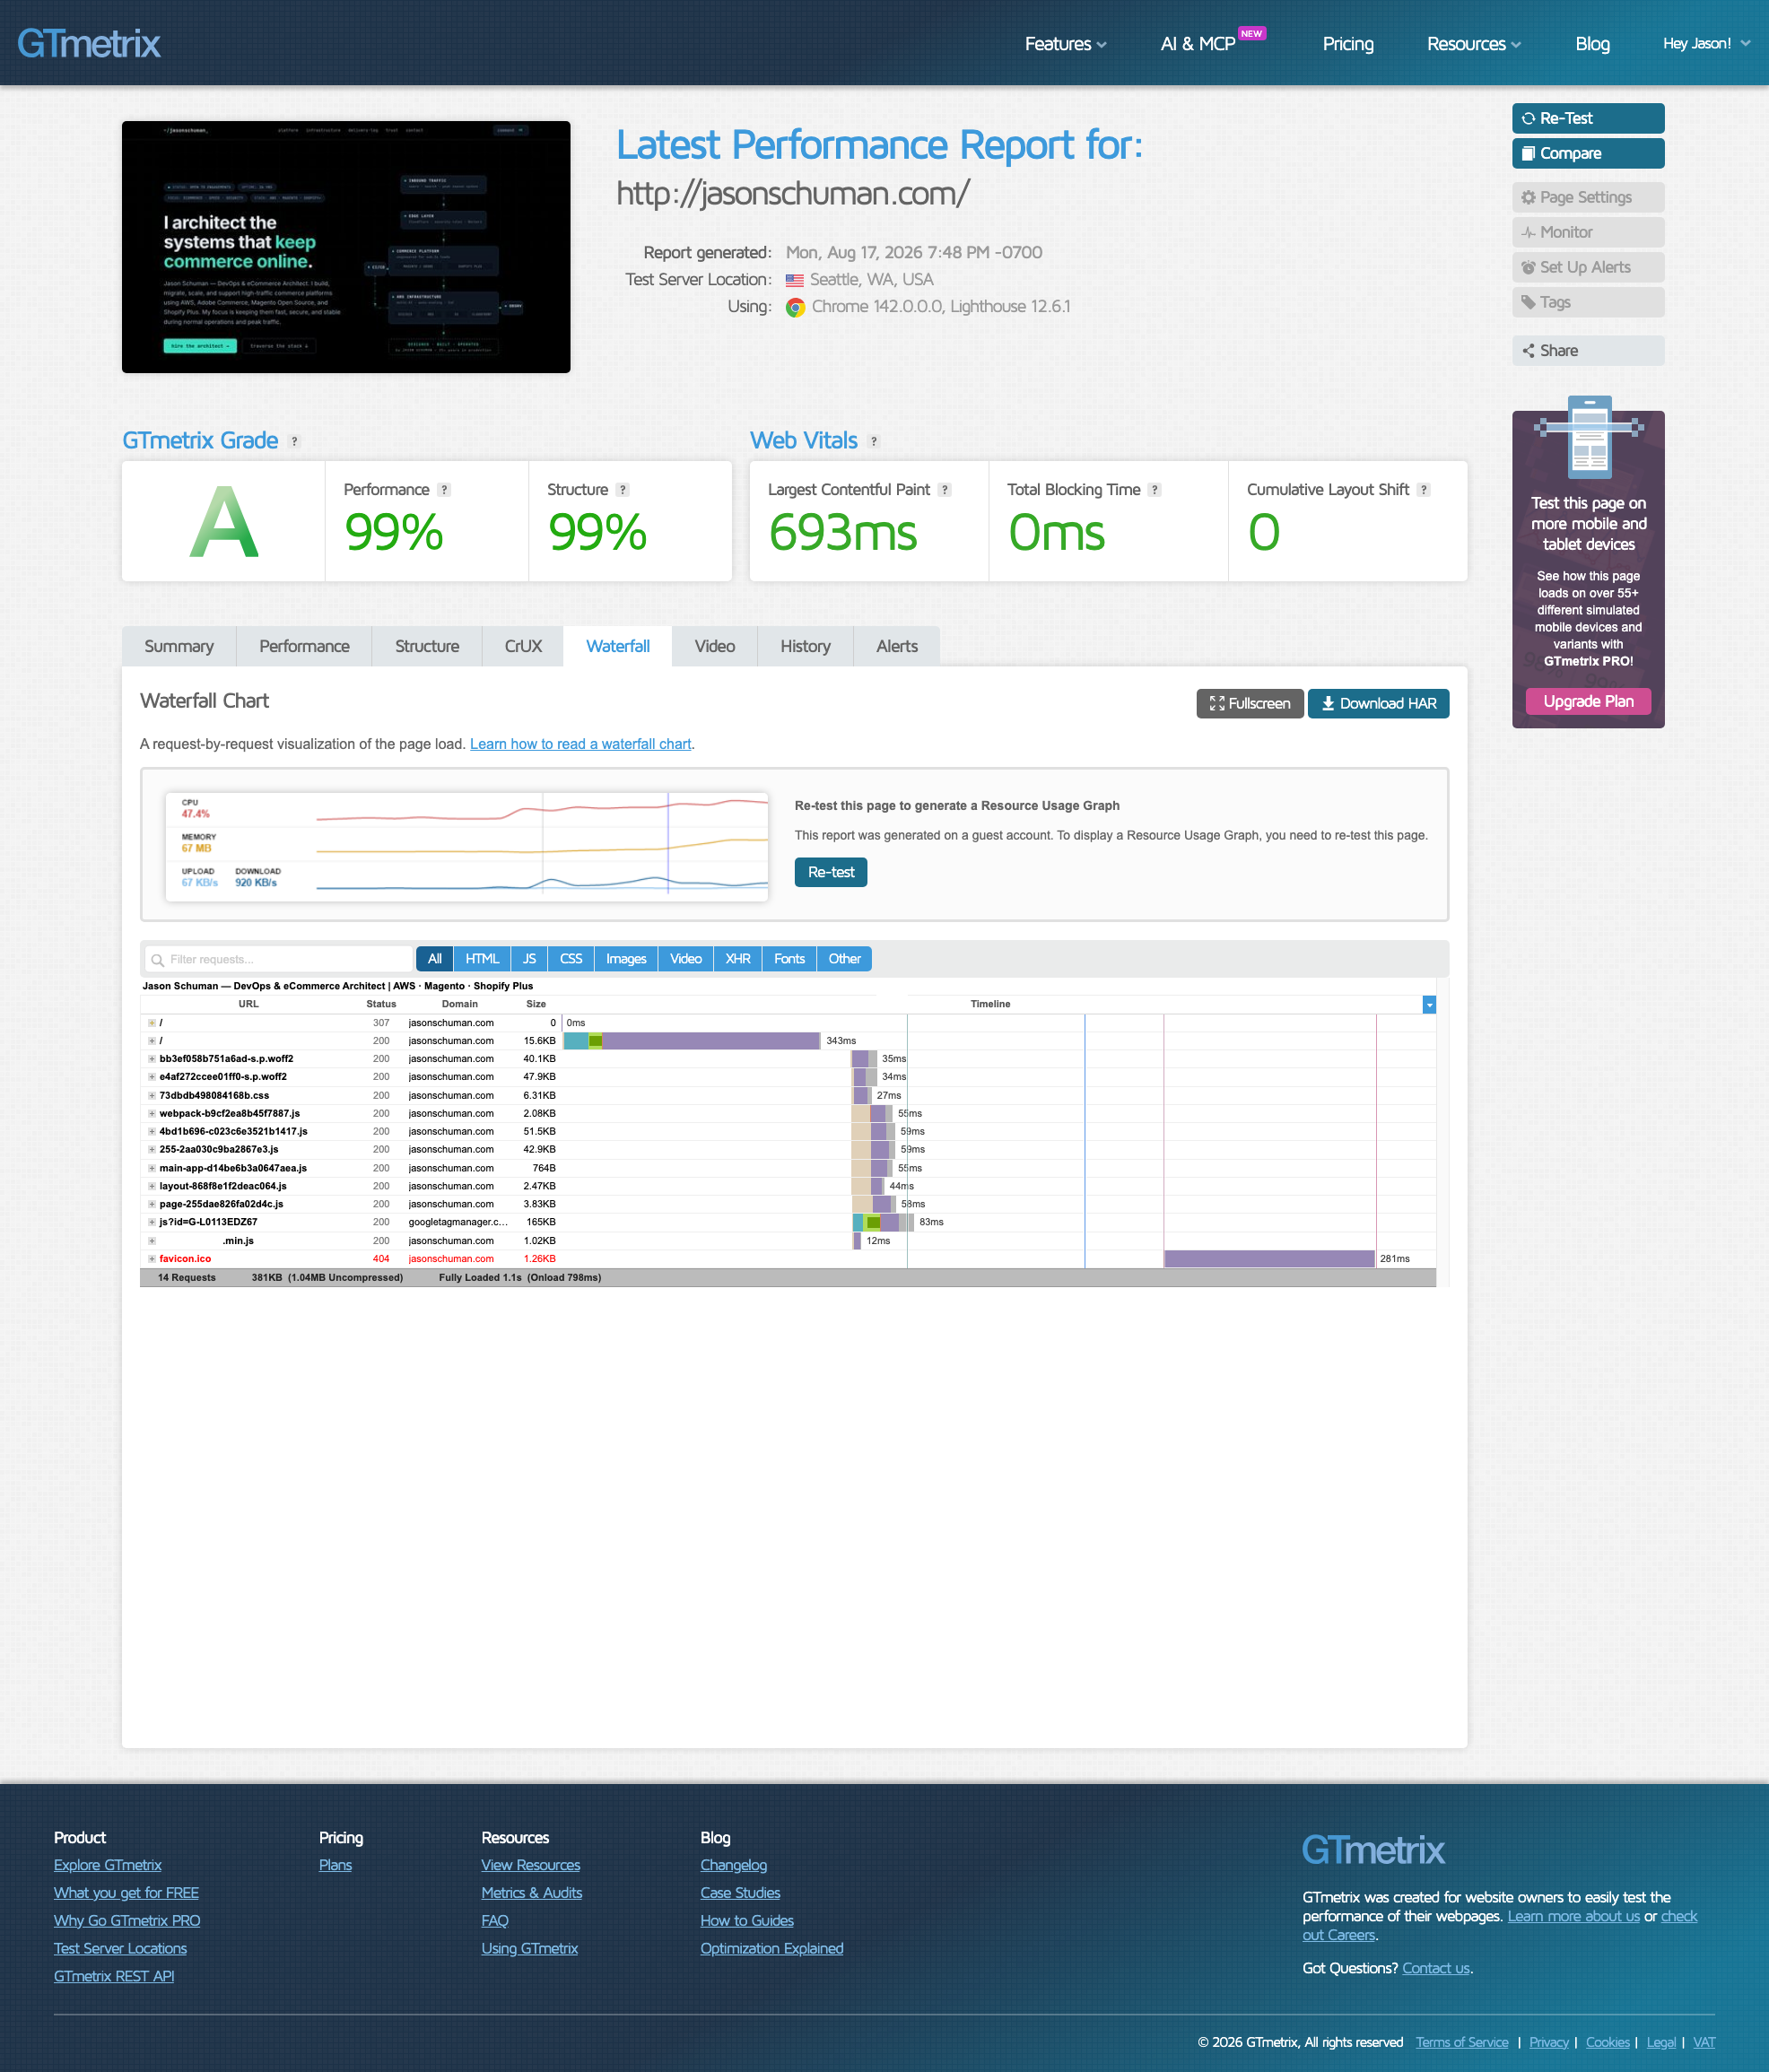
The Waterfall tab, request by request. The first bar is the server responding, and a cluster of image requests low in the chart is usually where a Magento store ships more bytes than it needs to.
Test location is the setting people get wrong
GTmetrix runs your test from a specific physical location, and the default may be nowhere near your customers. Distance from that test server to your store adds real latency, and testing from the wrong continent makes your store look slower than it is for the people who actually shop it.
Set the location to match where most of your customers are. If your store serves the United States, test from a United States location, and if you serve several regions, run the test from each so you can see how far your content travels.
Monitoring and alerts
On the paid plans, GTmetrix can run your tests automatically on a schedule and email you when a metric crosses a line you set. This turns the tool from something you remember to check into something that watches the store for you.
The value of monitoring is catching a regression close to when it happened. If your product page grade drops the day after a deploy, an alert ties the slowdown to the change that caused it while the trail is still fresh.
You can get most of this discipline for free by testing on a fixed schedule by hand, but if speed keeps slipping between manual checks, paid monitoring pays for itself in the deploys it catches.
Comparing reports to prove a fix
GTmetrix keeps your report history, which means you can put a before and an after next to each other and see exactly what a change did. This is how you prove a speed fix worked instead of assuming it did.
Run a test, make one change, run it again, and compare. Seeing the grade move, or not move, keeps you honest about which optimizations actually mattered and which just felt productive.
Keeping that history also gives you a trend over time, so a store that is slowly getting heavier shows up as a line drifting the wrong way rather than a surprise one bad morning.
A good grade is a floor, not a finish line
It is easy to treat an A as the end of the work, but a grade is a snapshot of one test on one day. A store that earned an A after a cleanup can drift back down as new extensions, images, and scripts pile up over the following months.
So do not file the grade away and forget it. The value is in watching it over time, because the slow slide from an A to a C is the story of nearly every store that stopped paying attention.
Treat a good grade as the baseline you defend, not a trophy you won once. The stores that stay fast are the ones that keep checking after the grade turned green.
Turning what you found into Magento fixes
Every GTmetrix finding lands back on a place inside Magento, and the mapping is the same familiar one. Render blocking resources and a high Total Blocking Time point at the theme and JavaScript, which means production mode, sensible bundling, deferring what is not needed for the first paint, and questioning heavy extensions.
A poor Largest Contentful Paint usually points at an oversized hero or product image and at server response time. Layout shift points at images and banner slots loading without reserved space, and at fonts swapping in late.
Server response time sits underneath all of it, and on Magento that is your full page cache, Varnish, Redis, and indexing. A faster server lifts every page at once, which makes it the biggest win the grade can point you toward.
Building it into a routine
GTmetrix earns its place when you use it on a rhythm rather than in a panic. Once a month, and again before and after any significant release, is enough to catch problems while they are still small.
Test the same pages each time, which means a category page, a key product page, and the checkout, from a location that matches your customers. Read the grade, split it into its two scores, then work the Structure tab from the top.
Save each report so you build a history. A grade that was an A and is now a C tells you a recent change hurt performance, and the comparison shows you what moved.
Why the grade shows up in the sales report
I keep GTmetrix in the rotation because its grade is the version of site speed that a whole team can rally around, from the developer to the owner signing off on the work. A clear letter that everyone understands is easier to act on than a metric only an engineer can read.
The trap is treating the letter as the goal. The goal is a fast experience on the pages that make money, and the grade is a proxy for that, useful right up until you start gaming it instead of fixing the store.
Read the grade, split it into Performance and Structure, work the Structure tab, and prove your fixes with a before and after. Do that on your product and checkout pages and the grade becomes a number that tracks your conversion rate rather than your ego.